Analyzing a World History Textbook
When I introduce my students to the Haitian Revolution, I summarize the slave revolt and in Saint-Domingue and the resulting Haitian independence. Then I summarize the French Revolution, a movement interconnected with the events in Haiti that occurred at roughly the same time.
When I ask my students which revolution they think is more important. They always say Haiti.
Then we look at our textbook.
My student’s textbook dedicates 32 pages to the French Revolution. The Haitian Revolution gets almost a whole page.
The Unit plan that guides my students through a CCC inquiry (Essential Question: Why has the Haitian Revolution been forgotten?) can be found here (there is also with a Social Education article here and a Visions of Educations podcast about the article here), but the problem of whitewashing World History isn’t limited to Haiti. Why all the emphasis on Columbus and other conquistadors with nary a mention of Polynesian travelers? Why does King Leopold’s murderous regime in Congo not get the space equal to Hitler and the Holocaust? Nearly every historical event and time is explored through a European lens.
This year, I decided to begin the year with a systematic and critical look at our textbook. The activity serves several purposes:
· It gives students raw data about their textbook that they will cite in their essays throughout the year.
· It’s a great collaborative assignment: Students work individually, discuss as a team, and the culmination of all their work creates useful class document that the each helped create.
· It’s a nice way for students to begin to explore the text features of their textbook in a more authentic way then completing textbook search worksheet
· Great discussions happen almost effortlessly as the class chart comes together.
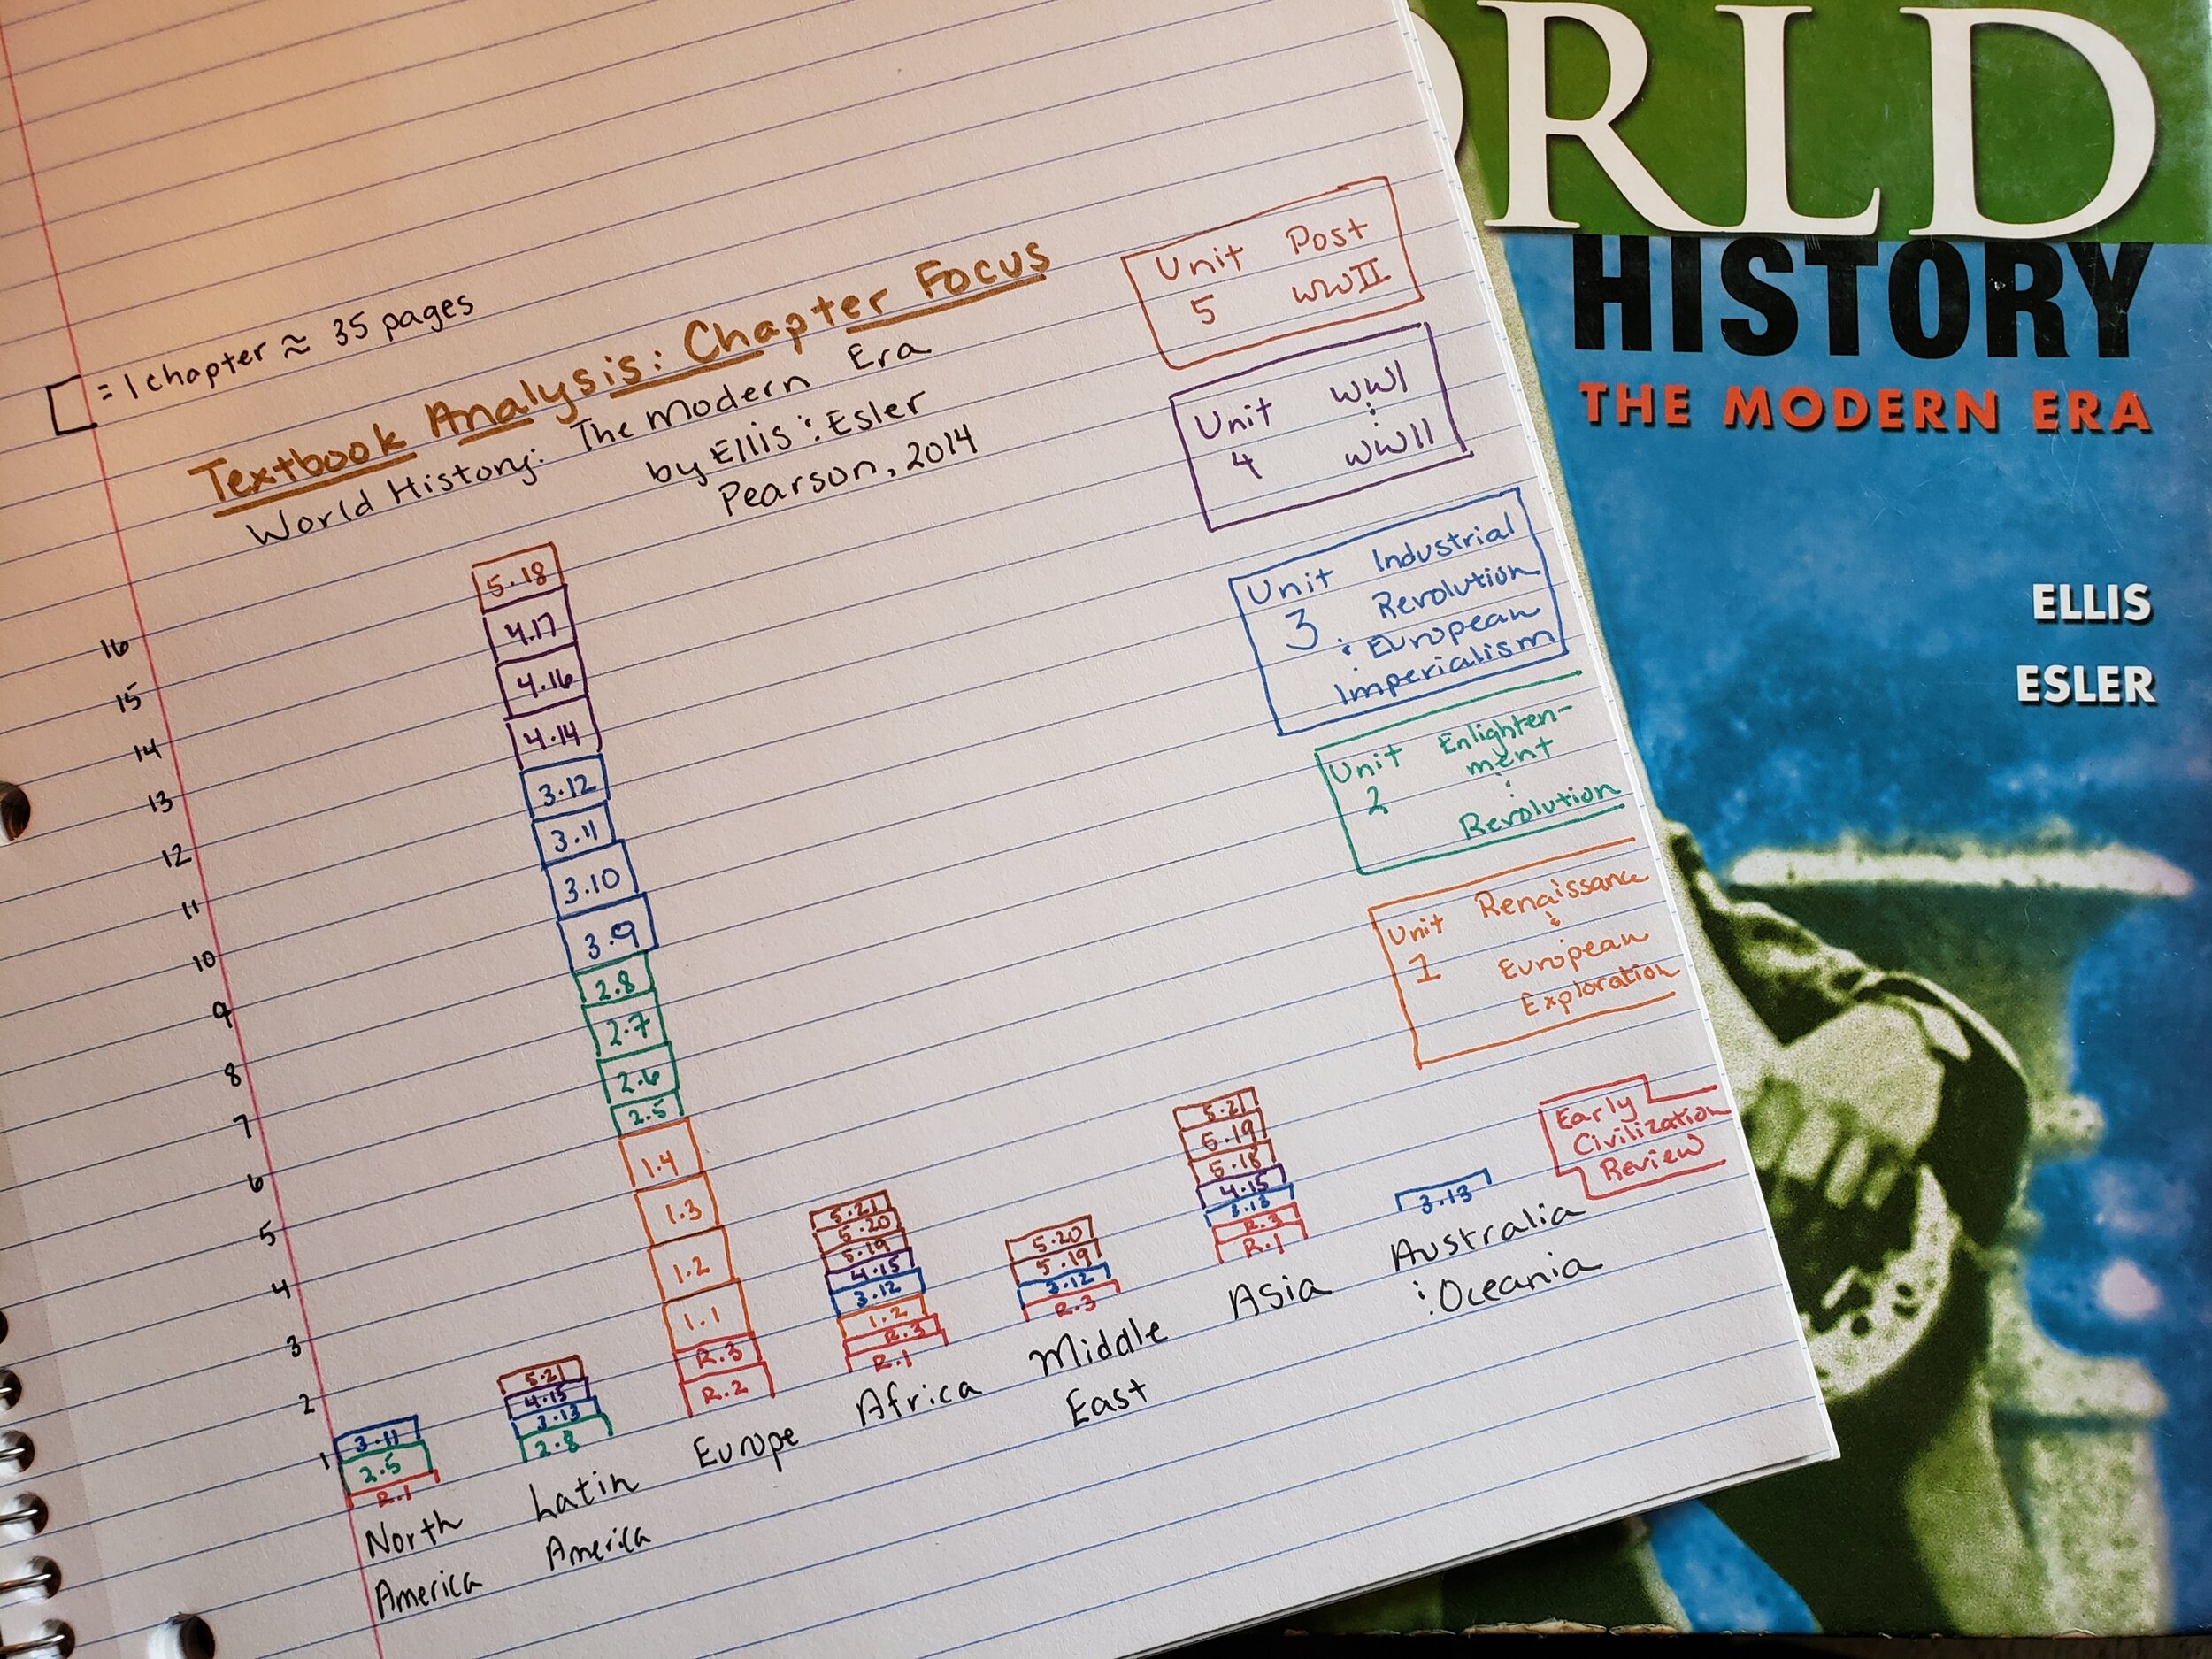
This year, students reported their finding via zoom and I created the graph below.
Here is what I’ll do next year, once my students and I are (hopefully!) back in the classroom:
1. Assign each student a chapter (about 30 pages) to analyze. My textbook has five units broken into 22 chapters, so some students will need to work in pairs. While reading, they’ll answer the following questions:
What is the title of the chapter section?
Where does this chapter section take place?
Who are the historical people discussed in the section? Who has agency (who has the ability to make their own free choices)?
Who is most represented as having agency in your section:
i. North Americans
ii. Latin Americans
iii. Europeans
iv. Africans
v. People from the Middle East
vi. Asians
vii. Australians and Polynesians
2. Create a space on a classroom wall to create a big ‘ole bar graph. Put the names from step 1.d along the bottom to make the x axis of a bar graph.
3. Give each student an index card
All index cards must be the same size
You can color code these: Unit One=Pink, Unit Two=Orange, etc.
Have students write the name of who is most represented on the card and the section name and title. If two (or more) groups were represented in the chapter, students can tear their index card in half (or thirds, etc.) and write the section name/title on both halves.

4. Have each student place their index card on the graph to create a bar graph (some Tetris may be required to fit those halves together!). You could do this presentation style, wherein each student comes up and explains their index cards to the whole class, but I think it would drag a bit. I think I’ll give the whole class an independent task to work on and then call each table-group over to the wall to place their index cards. That way I can have a more intimate mini-discussion with each table group about their findings while also ensuring that their index cards are properly placed.
5. After all index cards are placed and the graph is created, a whole class discussion is in order. Some possible questions:
Who is most represented in our textbook? Why do you think textbook authors made this choice?
How does textbook representation affect us today? Are we more likely to respect Europeans because they show up more in textbooks? Are we more likely to dismiss groups of people who DON’T regularly show up in textbooks?
How should we combat textbook bias in class?
What actions could we take to improve textbooks and/or learning in the future?